Service Mesh Visibility
In order to be able and trace and monitor all of our application calls we will need to expose the Grafana and Zipkin servers
- Expose Grapha and Zipkin.
You can ignore any warning messages generated by the bellow command.
kubectl get svc -n nginx-mesh grafana -oyaml | sed 's/ClusterIP/LoadBalancer/g' | kubectl apply -f -
kubectl get svc -n nginx-mesh zipkin -oyaml | sed 's/ClusterIP/LoadBalancer/g' | kubectl apply -f -
- Get the svc external ip. Wait until it changes from “pending” to an IP address
kubectl get svc grafana zipkin -n nginx-mesh
Output
- Browse to the Grafana dashboard
http://<GRAFANA-EXTERNAL-IP>:3000
You can get a general look for you application status. The Grafana dashboards can be customized to your hearts desire.
-
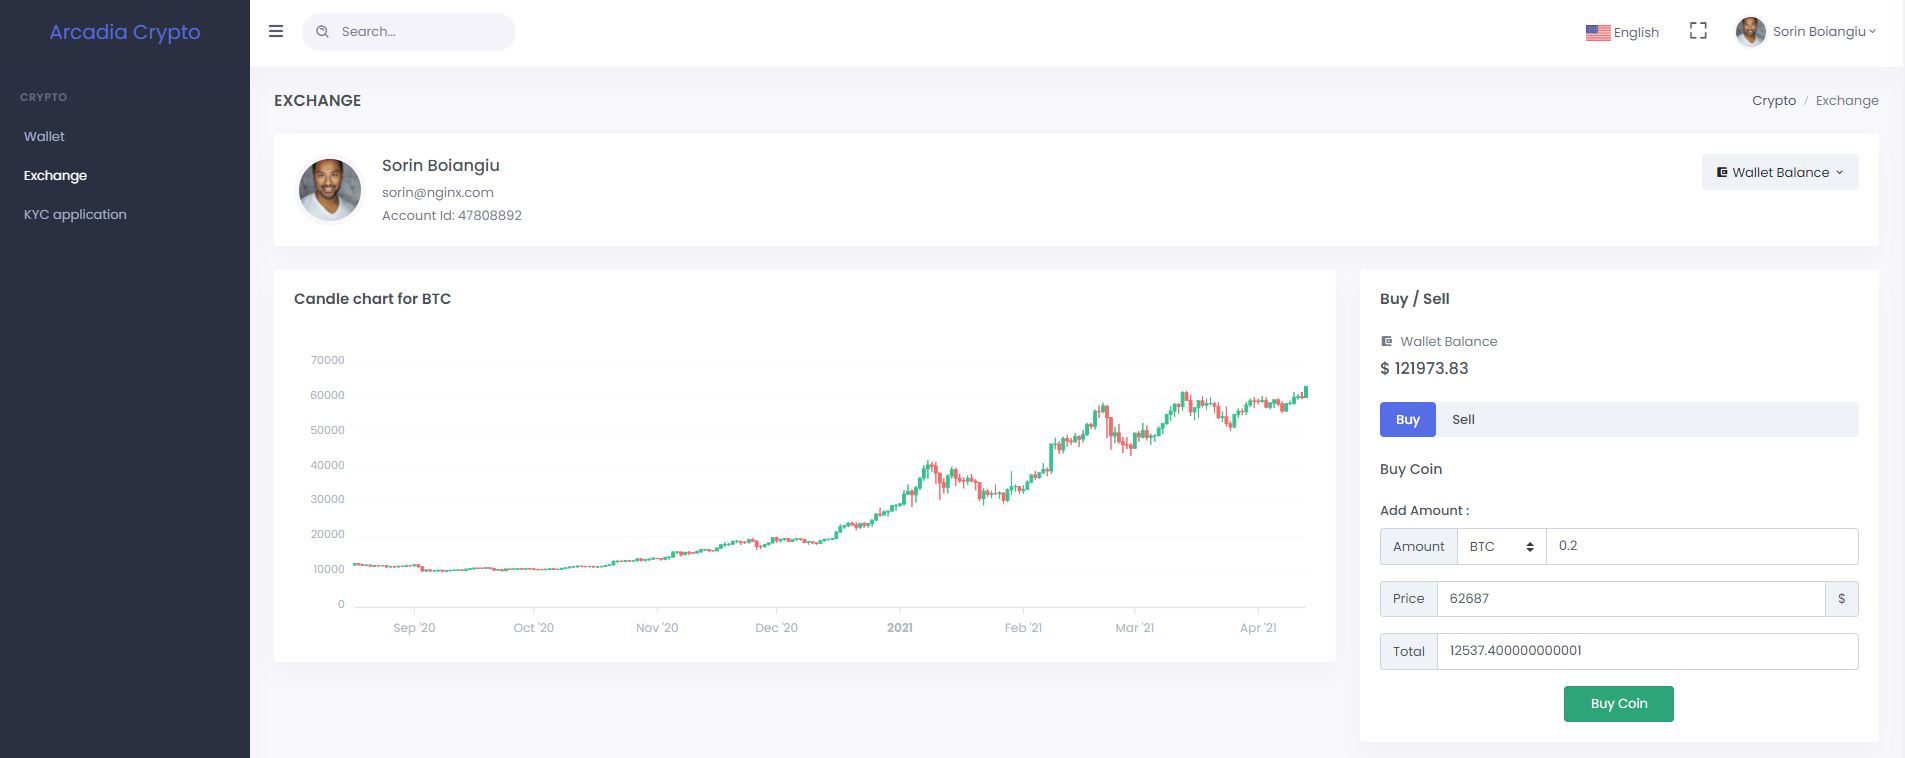
Go and buy or sell crypto coin. We will use Zipkin to trace this operation through the different services.
-
Browse to the Zipkin dashboard
http://<ZIPKIN-EXTERNAL-IP>:9411Create a filter as in the bellow image. Click on the result that looks like the first entry.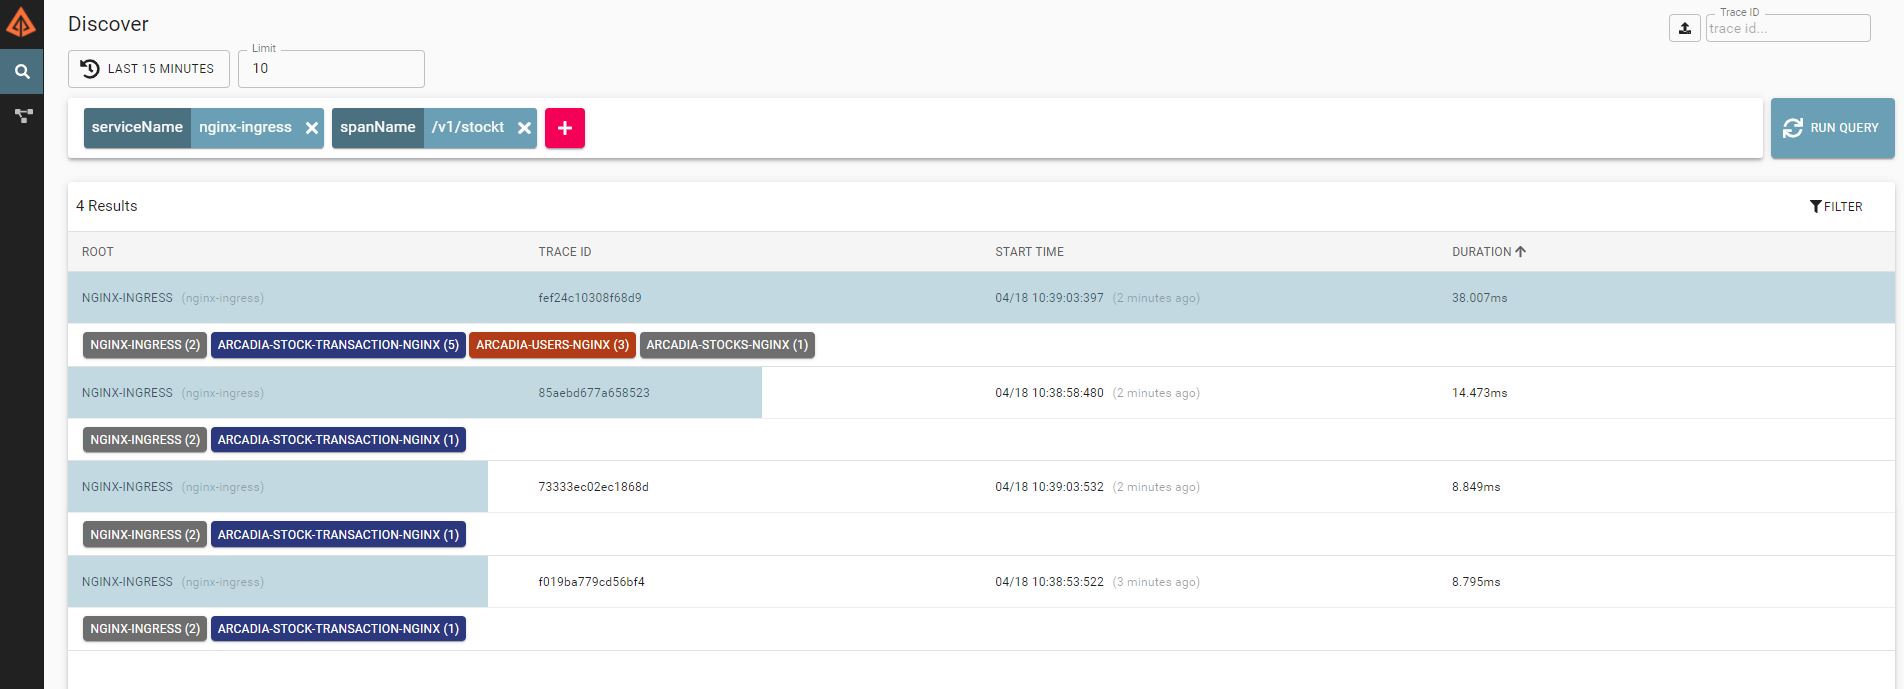
-
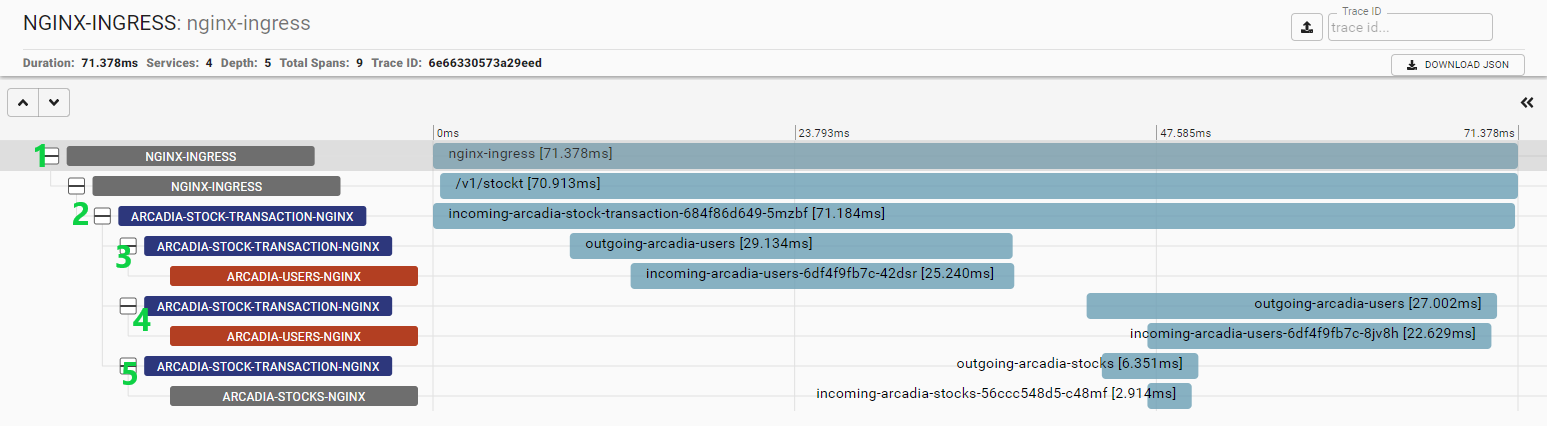
When buy or selling crypto the HTTP from the browser is sent to the application.
1 - First it gets to the Nginx Ingress
2 - The ingress forwards it to the stock transaction service
3 - In order to perform the operation the stock transaction service contacts the user service to get the current account id
4 and 5 - Next will again contact the users service to get the account information ( balance and crypto currencies), the stocks service to get the current buy and sell prices.
Once the operation has been validated and approved it will be recorded in the database and a success response returned to the client.